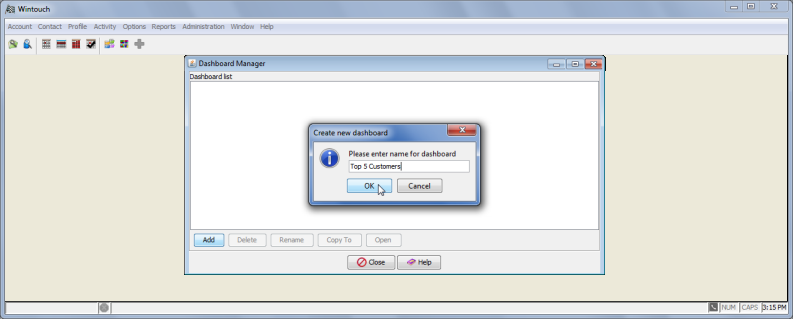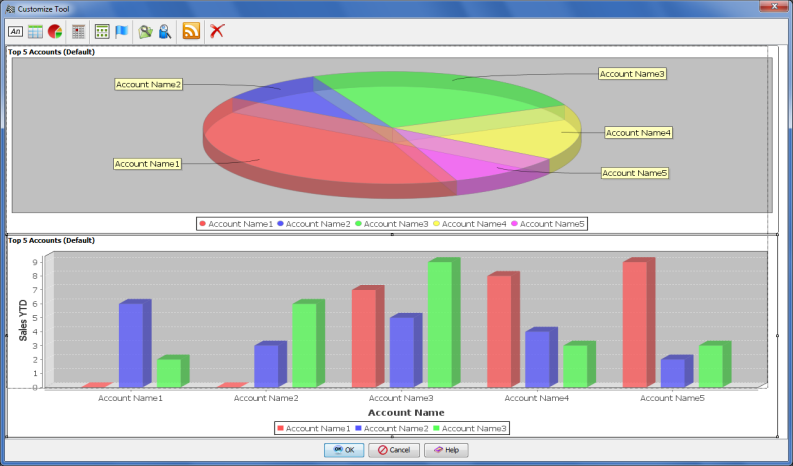

The Dashboard Customize Tool window is used to customize the dashboards. From this window you can add new dashboards, or edit and delete existing dashboards.
Insert Buttons
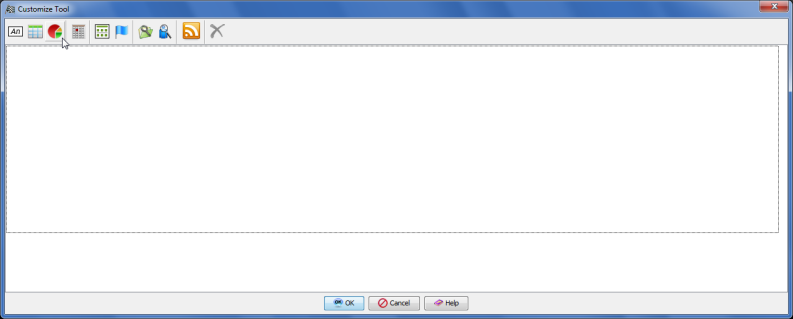
The chart buttons are located in the upper left corner of the window. They appear as small icons. There are 4 of them each having their own function as defined below. If you hover with your mouse over the icon, each will give a pop up defining their action.
- Insert New Label: Use this button to insert a read only text field that is very useful for creating titles for your dashboards. You can edit the text by right clicking on the field and opening the properties dialog. The label can simply be dragged anywhere on the screen.
- Insert New Table: Select this button to add another dashboard in the form of a table. You can insert either a detail table or a summary table.
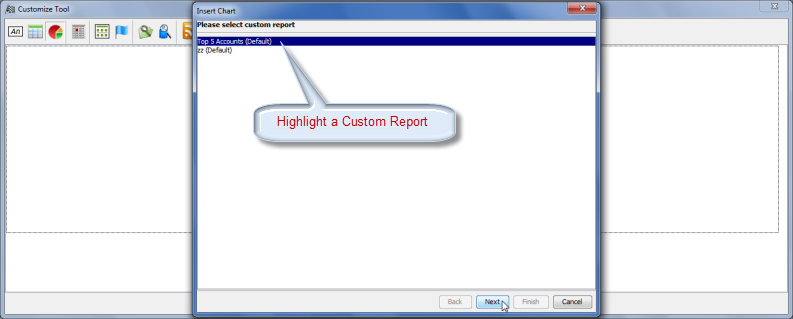
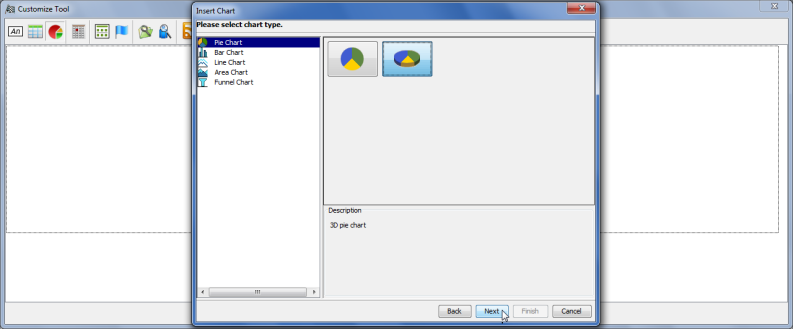
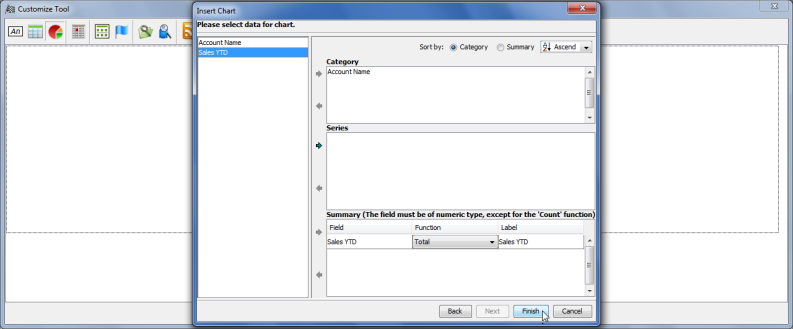
- Insert New Chart: Press this button to add a new dashboard in the form of a chart. There are 4 types of charts you may choose from, Pie, Bar, Line, and Area charts.
- Delete Component: Select this button to delete a dashboard. The button will be disabled until select one of the dashboard, then it becomes enabled.
- Insert Daily Activities: Use this button to insert a Daily Activities Component. This component allows the user to perform many of the tasks done in the Daily Activities window without leaving the Dashboard.
- Insert Account Summary List: Use this button to insert a listing component that will display all the Account Summaries that the user has opened.
- Insert Contact Summary List: Use this button to insert a listing component that will display all the Contact Summaries that the user has opened.
- Insert Account Search: Use this button to insert an Account Search component. This will allow the user to search for accounts from the Dashboard.
- Insert Contact Search: Use this button to insert a Contact Search component. This will allow the user to search for contacts from the Dashboard.
- Insert RSS Component: Use this button to insert an RSS feed component.
Push Buttons
OK: Press this button to save changes made in the Customize window.
Cancel: Press this button to cancel any changes made in the Customize window and close the window.
Help: Select this button to access online help documentation.
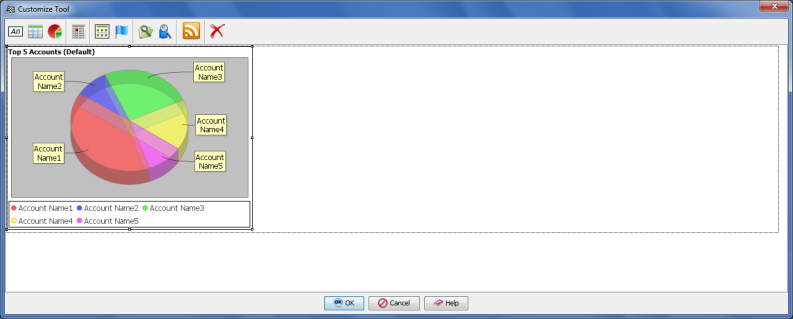
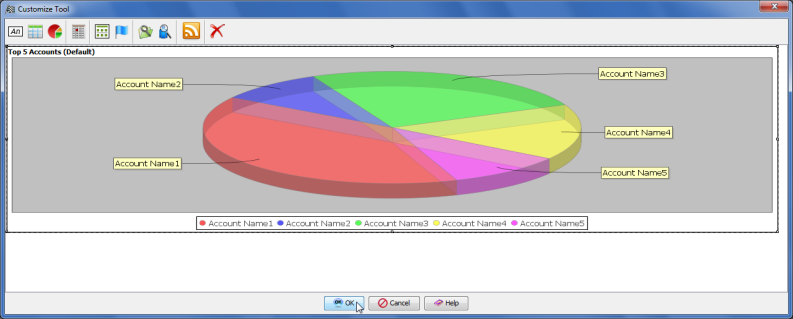
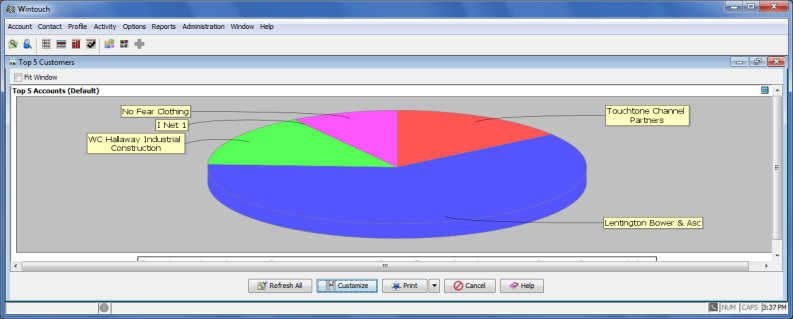
In the following example we are going to generate a pie chart that will display the year to date sales of our top 5 accounts.
Note: After step 3 the administrator users will select a location to save the Dashboard when the Save As dialog appears.