
The Account and Contact Summary Chart Feature
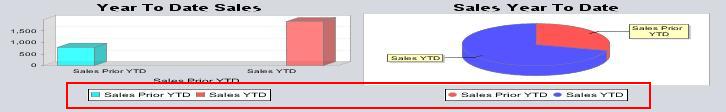
You can display Account Summary information in bar graph or pie chart view using the Chart feature. Simply press the Customize button in the Account Summary window, then use the right-click option to add a chart where you would like it to appear in the window layout. Multiple charts can be displayed in one Account Summary window. And, different Account Summary layouts can be saved for different account types allowing you to display a chart that contains the most relevant information.
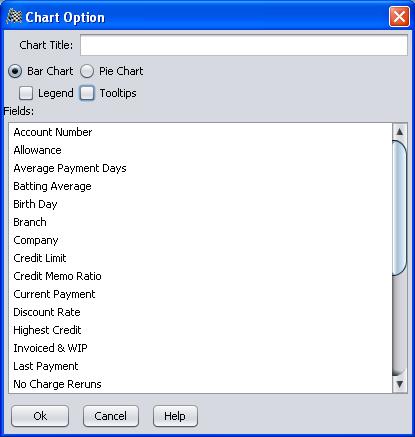
Chart Title
Type the name of your chart into the Chart Title: field.
Chart View (Radio Buttons)
Select one of these radio buttons to display one of the two available chart views.
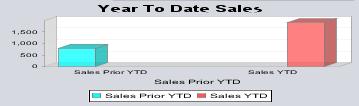
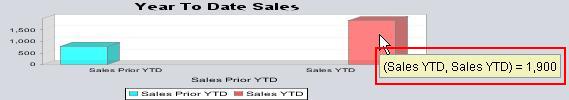
Bar Chart
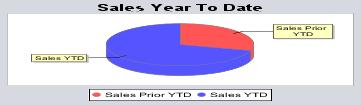
Pie Chart
Legend and Tool Tips (Check Boxes)
Legend: Check the legend check box if you wish to display a legend of which colors represent which field values at the bottom of your chart.
Tool Tips: Check the tool tips check box if you wish to enable mouse (hover over) field values.
Fields (Choosing the Fields to be Displayed)
Select the Field(s) you would like displayed in your chart. Hold down the CTRL key to select multiple fields for display.
Push Buttons
OK: Use this button to apply the Chart Options you have selected.
Cancel: Use this button to exit the Chart Options window without saving and applying changes.
Help: Displays online help for the active window.